By Wolf Richter for WOLF STREET January 30, 2020
The dreams of 3%-plus economic growth in the US remained dreams in 2019, despite tax cuts and ballooning federal government spending, which are a stimulus. But the resulting budget deficit caused the gross national debt to balloon far faster than GDP grew.
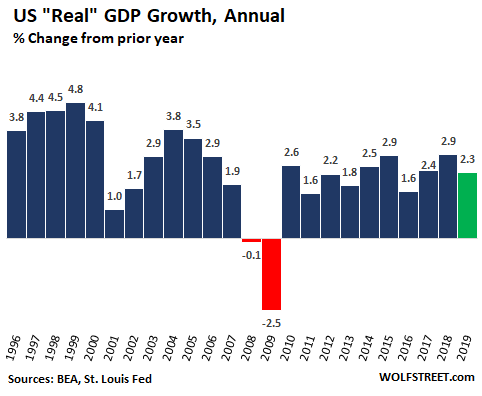
In the fourth quarter, the economy as measured by inflation-adjusted “real” GDP grew at an annual rate of 2.1% from the third quarter. This brought the total growth of real GDP for all of 2019 to 2.3%, which is the average annual GDP growth since 2012:
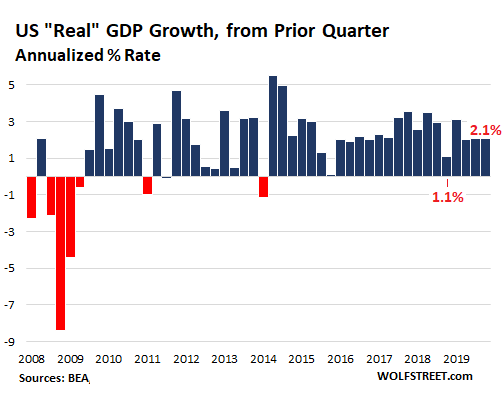
This is according to the first estimate by the Bureau of Economic Analysis, released today, based on incomplete data. As more data accumulates, the BEA revises the estimates. The next revision will be released on February 27. These revisions are often minor, but sometimes they’re whoppers, completely changing the economic picture, as they did for Q4 2018, when the initial estimate of GDP growth was a hot 3.1%, which was subsequently crushed down to a frigid 1.1%.
In Q4 2019, the “real” GDP growth rate of 2.1% was essentially the same as over the prior two quarters, and below the average growth rate since 2012 of 2.3%:
On the positive side in Q4, imports of goods and services fell 8.7%, with goods imports alone dropping 11.6% (a decline in imports adds to GDP). But exports ticked up only 1.4% (an increase in exports adds to GDP).
Also pushing up GDP in a big way: federal government expenditures in Q4 rose at an annual rate of 3.6%. This brought the increase in federal government spending for the entire year 2019 to 3.5%. Defense spending surged 4.9% in 2019. Nondefense spending inched up only 1.6%. We’ll get to the debt that this federal government spending produced in a moment.
Growth was dragged down in Q4 by the sharp decline in gross private domestic investment of 6.1%, including a 10.1% drop in investment in structures and a 2.9% drop in investments in equipment.
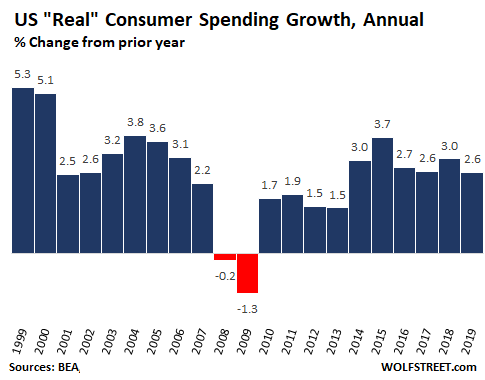
Consumer spending (“personal consumption expenditures” adjusted for inflation), which accounts for 68% of GDP, grew at an annual rate of 1.8% in Q4. While this growth rate was down from Q3 (3.1%) and Q2 (4.6%), it was higher than in Q1 (1.1%) and in Q4 2018 (1.4%). For the year 2019, consumer spending, on this inflation-adjusted basis grew 2.6%, at the low end of the range of the past six years:
GDP measures the economy in terms of the dollars that are spent or invested by consumers, businesses, and governments in a given time period. Illegal spending and investing – prostitution, retail sales of controlled substances, etc. – are not included in the US, though there are discussions under way about including it.
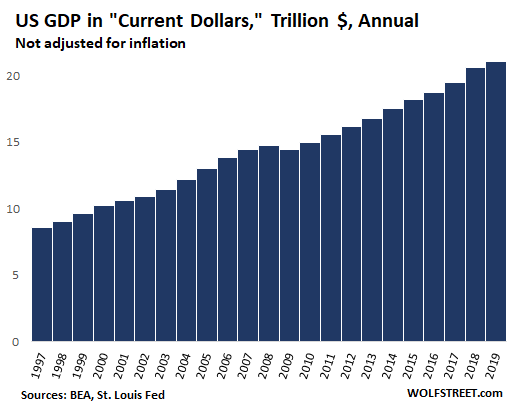
Nominal GDP, which is measured in current dollars and is not adjusted for inflation, increased by 4.1% in 2019, or by $849 billion from a year earlier, to $21.4 trillion:
Where do these dollars in GDP growth come from?
GDP measures the flow of dollars at a certain point. It does not include where the dollars came from that were invested or spent. In other words, GDP ignores the increase in debt.
Most of what the federal, state, and local governments spend in the US and invest in the US enters into GDP either directly or indirectly. Much of what the federal government spent came from tax revenues, fees, and other receipts. The remainder was funded by new debt.
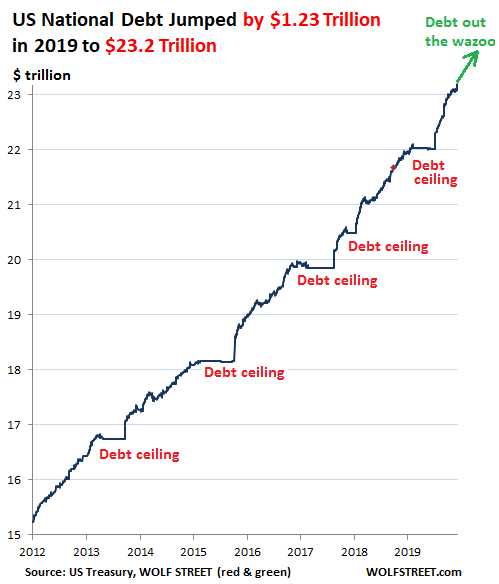
In the calendar year 2019, the federal government’s spending that made it directly into GDP calculations, released today, grew by 3.5%, with defense spending surging 4.9%, and nondefense spending ticking up 1.6%. Federal government deficit spending ballooned the US gross national debt by $1.23 trillion in the calendar year 2019, to $23.2 trillion.
But despite the surge in federal government spending, causing additional federal borrowing of $1.23 trillion in 2019, growth in nominal GDP totaled only $849 billion.
Let that stew for a moment: What would the economy have done with a more moderate increase, or no increase, in federal borrowing and spending?
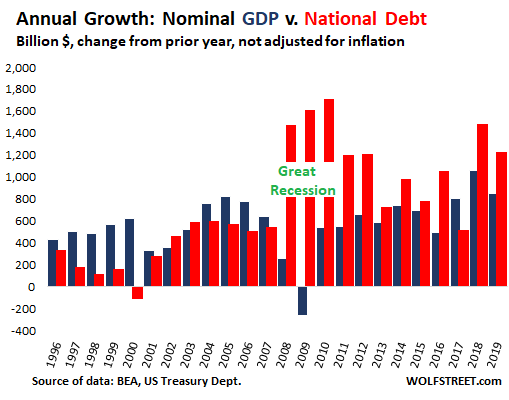
The chart below shows annual increases in nominal GDP in billion dollars (blue) and the annual increases in the gross national debt in billion dollars (red). Neither are adjusted for inflation. Note the special effects just before, during, and right after the Great Recession: Nominal GDP growth plunged in 2008 and went negative in 2009. During that time, unemployment skyrocketed, companies collapsed, federal tax receipts plunged, federal expenditures surged (unemployment insurance, etc.), and the deficit and the gross national debt exploded.
But instead of going back to the prior arrangements, where in good times, nominal GDP grew faster than the national debt, the national debt continued to outgrow nominal GDP. The only exception was 2017, when the debt-ceiling fight dragged a portion of the debt-increase into 2018 (average out 2017 and 2018 for a more accurate picture):
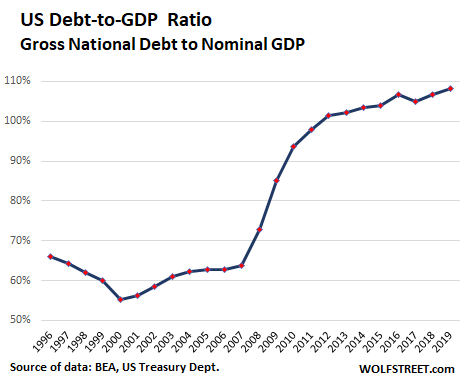
The year 2019 was also another milestone: The ratio of the US gross national debt to GDP jumped to 108%, up from 63% in 2006 on the eve of the Financial Crisis as all heck was already breaking loose:
And I will leave you with a chart of this issue that no one in Washington pays attention to anymore, other than the Fed, which pays lip-service to it by occasionally calling the federal debt-growth “unsustainable,” when challenged in a press conference. In terms of our elected officials in Washington, the rule is that debt doesn’t matter. Former fiscal hawks have been converted. And debt truly doesn’t matter until it suddenly does: